Прыгающий мяч
(→Создаём прыгающий мяч вручную) |
(→Создаём прыгающий мяч с помощью интерполяции фиксаторов) |
||
| Line 66: | Line 66: | ||
==Создаём прыгающий мяч с помощью интерполяции фиксаторов== | ==Создаём прыгающий мяч с помощью интерполяции фиксаторов== | ||
| − | В режиме интерполяции TCB мы можем изменять | + | В режиме интерполяции TCB мы можем изменять такие параметры фиксаторов как Натяжение, Непрерывность, Отклонение и Временное натяжение, поэтому есть возможность легко изменять характер интерполяции в месте нахождения фиксатора делая его плавным или резким. |
| − | + | Сейчас мы возьмём те же значения для верхней и нижней точек что и в предыдущей таблице, но будем использовать только по одному фиксатору для каждой крайней точки, а оставшуюся часть кривой создадим с помощью TCB параметров. | |
| − | + | Таблица фиксаторов будет выглядеть так: | |
| − | + | ||
| − | + | ||
{| | {| | ||
Revision as of 12:54, 18 November 2012
|
Warning! This page contains outdated information. The release of Synfig Studio 0.64.0 introduced new terminology and this translated page needs to be updated according to original English text. You can help updating this page - see instructions here. Thank you! |
В этой статье рассказывается о том как создать анимацию с прыгающим мячом. Мячи в мультиках обычно имеют достаточно причудливую форму когда двигаются и особенно когда ударяются об землю, но заниматься созданием таких деформаций мы будем в следующий раз, а сейчас рассмотрим способы создания самого движения мяча в пространстве.
Contents
Несколько разных способов достичь результата
Есть четыре способа создать прыгающий мяч используя Synfig:
- Сделать прыгающий мяч вручную, это потребует создания нескольких фиксаторов которые надо расположить так чтобы положение мяча совпадало с параболической траекторией его движения (во времени и пространстве).
- Используя параметр интерполяции фиксаторов, когда они установлены в режим TCB interpolation. Это значительно уменьшает количество необходимых фиксаторов и делает тайминг движения мяча на много проще.
- Используя привязывание к кривой, если вы нарисуете путь по которому должен двигаться мяч используя кривую BLine, то достаточно просто сделать так чтобы мяч следовал вдоль кривой и даже изменял свою скорость во время движения.
- Создать математическое уравнение описывающие движение мяча, это достаточно сложный способ но именно он должен оказаться самым точным из всех.
Создаём прыгающий мяч вручную
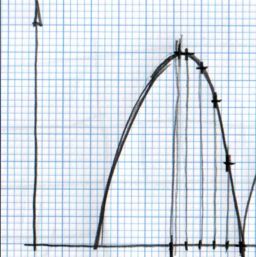
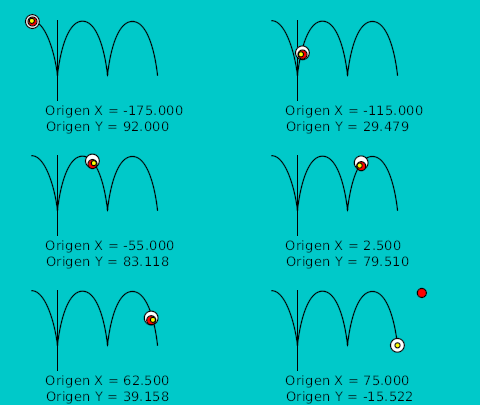
Принцип создания прыгающего мяча вручную заключается в том чтобы нарисовать желаемую кривую траектории на бумаге, а за тем прочертить от горизонтальной оси линии пересекающие кривую траектории с одинаковыми промежутками между собой. Примерно как на этом рисунке:
Вы можете заметить что одинаковые промежутки на горизонтальной оси дают на вертикальной оси не одинаковые промежутки, это нормально так как проистекает из природы кривой.
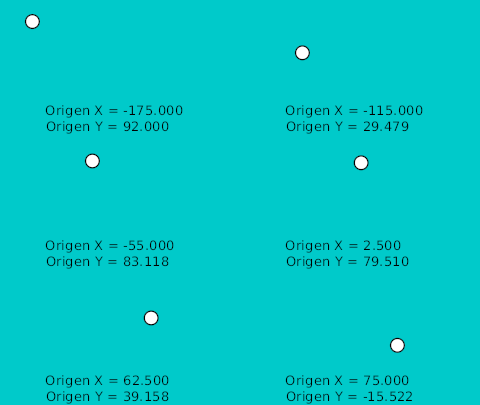
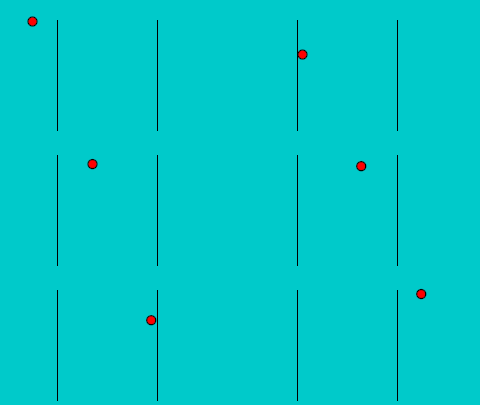
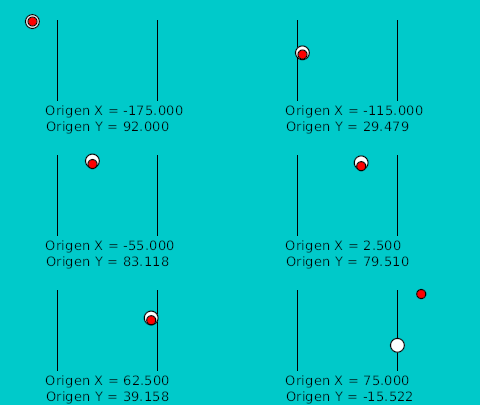
Определив точки пересечения с кривой в двух измерениях мы можем перенести их в Synfig напрямую, используя для этого сетку. Нарисовав их мы исправляем значения координат так чтобы они были полностью симметричны, что наглядно показано в этой таблице:
| Время | Позиция X | Позиция Y | Комментарий |
| 0f | -175.0 | 92.0 | Высшая точка |
| 4f | -165.0 | 92.0 | |
| 8f | -155.0 | 81.118 | |
| 12f | -145.0 | 63.678 | |
| 16f | -135.0 | 29.479 | |
| 20f | -125.0 | -15.522 | Низшая точка |
| 24f | -115.0 | 29.479 | |
| 28f | -105.0 | 63.782 | |
| ... | ... |
Вы можете видеть что позиция Х возрастает с шагом в 10.0, а позиция Y воспроизводит параболическую траекторию кривой.
Чтобы получить большее количество прыжков просто скопируйте фиксаторы (поместите курсор на шкале времени в нужном месте, затем наведите мышь на фиксатор, нажмите правую кнопку мыши и выберите "продублировать") создав симметричное движение. Вам также придётся отредактировать значения Х вручную чтобы они возрастали на 10.0 на каждом новом фиксаторе.
Ниже вы можете видеть график созданного вручную движения мяча.
Нижние точки графика не острые, чтобы исправить это нужно поместить большее количество фиксаторов в районе нижней точки (20f). Попробуйте сделать это сами с помощью приложенного файла с исходниками.
Ниже вы видите готовую анимацию и файл.
File: Media:manual.sifz
Создаём прыгающий мяч с помощью интерполяции фиксаторов
В режиме интерполяции TCB мы можем изменять такие параметры фиксаторов как Натяжение, Непрерывность, Отклонение и Временное натяжение, поэтому есть возможность легко изменять характер интерполяции в месте нахождения фиксатора делая его плавным или резким.
Сейчас мы возьмём те же значения для верхней и нижней точек что и в предыдущей таблице, но будем использовать только по одному фиксатору для каждой крайней точки, а оставшуюся часть кривой создадим с помощью TCB параметров.
Таблица фиксаторов будет выглядеть так:
| Time | X position | Y position | Comments |
| 0f | -175.0 | 92.0 | Highest point |
| 20f | -125.0 | -15.522 | Lower point |
| 40f | -75.0 | 92.0 | Highest point |
| 60f | -25.0 | -15.522 | Lower point |
| ... | ... |
As you can see the number of points is reduced drastically.
In you only use a default TCB interpolation it would give you a poor result. Look at the graph:
But if you edit the TCB parameters this is the result you obtain:
The TCB parameters are the following:
| Time | X position | Y position | Comments | Tension | Continuity | Bias | Temporal Tension |
| 0f | -175.0 | 92.0 | Highest point | 0.0 | 0.0 | 0.0 | 0.0 |
| 20f | -125.0 | -15.522 | Lower point | 0.0 | -2.2 | 0.0 | 0.0 |
| 40f | -75.0 | 92.0 | Highest point | 0.0 | 0.0 | 0.0 | 0.0 |
| 60f | -25.0 | -15.522 | Lower point | 0.0 | -2.2 | 0.0 | 0.0 |
| 80f | 25.0 | 92.0 | Highest point | 0.0 | 0.0 | 0.0 | 0.0 |
| ... | ... | ... | ... | ... | ... | ... | ... |
That's the resulting animation:
And the sample file: Media:waypoint-2.sifz
Notice that the curve at 0f and at 80f are not properly formed. It is due to the fact that the TCB parameters needs to belong to an intermediate waypoint to have effect. If the waypoint is extreme (the end or the beginning of the animation for the parameter it cannot modify the curve. To solve that you should split the X and Y coordinates of the Origin and apply a Ease In/Out interpolation to those Y coordinate and leave the X coordinate with the current interpolation. So please consider only the bounces between the two black vertical lines.
Notice also that you can make the highest point more flat increasing the Temporal Tension parameter (a good value can be 0.5). This would produce a deformation to the X coordinate so you need to separate both coordinates to do that. Try it by your self editing the attached file. I have left the highest point to have the default values.
Here is a comparison of both bounces a the same time.
With this approximation you can easily modify the Y coordinate of the highest points. The interpolation would take care of the rest. With the manual interpolation you should calculate all the x/y coordinates od the resulting curve for a lower bounce. You can record the values into a calculus sheet and just multiply the Y value by a reduction factor. Anyway you have to enter all the value pairs one by one.
Ball Bounce following a path
Before reading this section you should be familiar with Doc:Following_a_BLine/ru tutorial.
The use of a path to perform the bounce has some advantages:
- You can see the complete ball bounces in one shot.
- You can make the ball rotate along the path (this would allow to make bounces of non round objects).
- You can make bounces to vertical, horizontal or any kind of walls you like. Just draw the path.
and some disadvantages:
- It is difficult to control the horizontal movement. It is due to the parameter that moves the object through the path is linked to the number of vertices of the path. If the path has five vertices and it is an open Bline the parameter that defines the path has the following values when define each vertex: 0.0 for the first, 0.25 for the second, 0.5 for the third, 0.75 for the fourth and 1.0 for the fifth (and last) independent of the length of the Bline section between vertices.
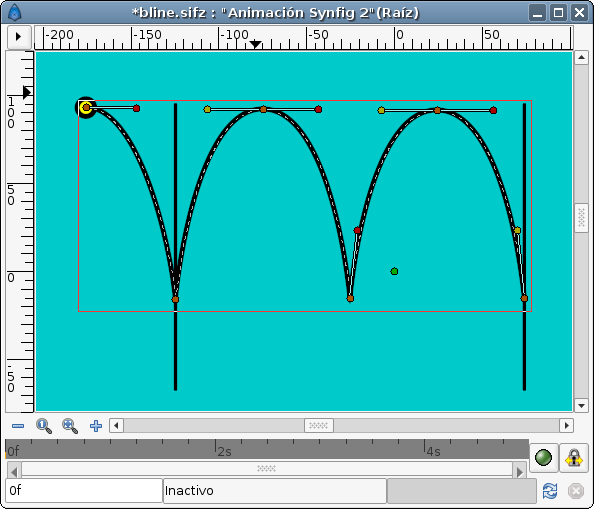
The first thing you have to do is define the path that the bouncing ball is going to describe. I've used the previous manual animation to draw this Bline:
(You can notice that there are some missing tangents. It is due that I've linked the parallel tangents of the peak points of the path. It is more easy to setup because you only have to control two tangents to control all the tangents at the same time.)
Once defined then create a circle or the ball you want to move and place it centered at the origin (0,0). I prefer that you encapsulate it and use the paste canvas origin parameter to make the animation. Once encapsulated select the bline you have created and the paste canvas of the encapsulated ball and select the Origin duck of the paste canvas. Then right click over the bline (avoiding any duck) and select "Link to Bline". You can see my green ball in the figure.
Once linked you can drag it and it will stick to the bline.
Now expand the Origin parameter of the paste canvas layer of the encapsulated ball and search for the Amount parameter. This parameter is the one you need to animate to move the ball over the Bline.
Considering the example, the bline has 6 vertices and 5 bline sections. If you are following the tutorial try to set that parameter to 0.0, 0.2, 0.4, 0.6, 0.8, 1.0 and you will see that the ball moves to each vertex. Now create the following waypoints:
| Time | Amount | Comments |
| 0f | 0.0 | Highest point |
| 20f | 0.2 | Lower point |
| 40f | 0.4 | Highest point |
| 60f | 0.6 | Lower point |
| 80f | 0.8 | Highest point |
| 100f | 1.0 | Lower point |
This coincides with the main waypoints of the last method we have seen. But look what's the result:
Its X movement graph looks ugly. It is not a straight line that means that the horizontal velocity is not constant. To solve that you have to insert more waypoints in the middle.
To do that I've uses the animation of the second method to try to match the position at regular intervals. This is the table I've needed.
| Time | Amount | Comments |
| 0f | 0.0 | Highest point |
| 20f | 0.2 | Lower point |
| 24f | 0.2626 | |
| 28f | 0.3085 | |
| 32f | 0.3463 | |
| 36f | 0.3741 | |
| 40f | 0.4 | Highest point |
| 44f | 0.4245 | |
| 48f | 0.4554 | |
| 52f | 0.4926 | |
| 56f | 0.5280 | |
| 60f | 0.6 | Lower point |
| 64f | 0.6629 | |
| 68f | 0.7075 | |
| 72f | 0.7445 | |
| 76f | 0.7783 | |
| 80f | 0.8 | Highest point |
| 84f | 0.8253 | |
| 88f | 0.8539 | |
| 92f | 0.8928 | |
| 96f | 0.9375 | |
| 100f | 1.0 | Lower point |
Now look to the graphs again and notice that the X travel is now a straight line.
This is the resulting animation and the sifz file.
The sample file: Media:bline.sifz
It is supposed that the small yellow ball should follow the red one all the time but you can see that is goes a little faster some times and a little slower other times. It is due to I need to use different times for the adjusting waypoints or add more of them.
Mathematical emulation
Anyone want to try? :)

